Contact us today!
If you have any queries or wish to make an appointment, please contact us:
saskia.burrows@loveexcel.co.uk
Or use our contact form.
Get social with us.
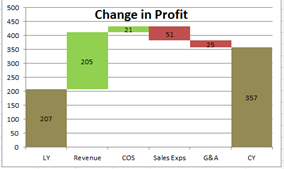
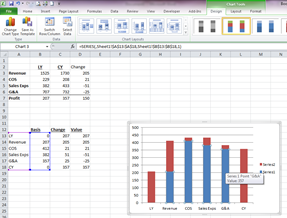
Easy waterfall Graph
How to create a waterfall graph for variances
It is possible to setup formulas so that as your last year and current year numbers change the graph changes to reflect the new numbers.
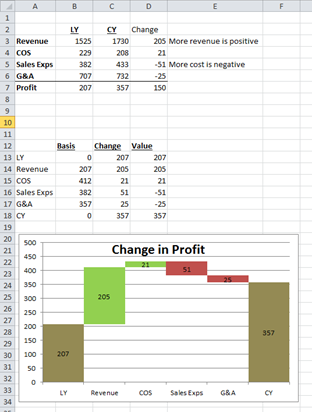
To create this you insert a graph which looks at cells B13:C18 for this example.
The first column is the basis formula.
The second column is the absolute (ABS) value of the change, or the values to compare.
Cell B14 below says:
=IF(D14>0,IF(D13>0,B13+C13,B13),IF(D13>0,B13+C13+D14,B13+D14))
This formula can be copied down for the other basis calculations.
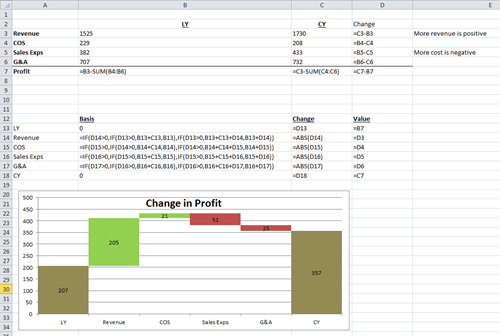
The graph should be a 2D column graph as below.
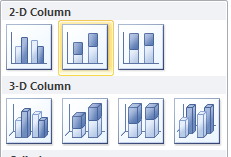
You will then need to right click on the blue part of the graph and format data series.
Choose gap width: no gap from series options.
Choose no fill from fill options
Add a title, values and colour positive movements green and negative movements red.